The Transactions Explorer has enabled government to track progress on its key performance indicators for the first time.
Cost per transaction and digital take-up are two critical performance metrics in the government’s digital strategy.
The latest data on costs and digital take-up from government services show an exciting trend; the cost of transactions between the government and public service users is steadily falling, and the digital take-up is rising.
The other two metrics covered in the digital strategy (user satisfaction and completion rate) are also worth calling out; ultimately the most noticeable difference government will make to its digital services will be in the quality of the user experience.
Despite an environment of fiscal austerity, we want to make “digital services so good that people prefer to use them”. We have begun to systematically measure user satisfaction, and the proportion of people that manage to get from the start to the end of services. We hope to show a similarly positive trend emerging over the next 12 months.
Costs falling, digital rising

We began collecting information on costs over two years ago. Until now, we haven’t wanted to draw conclusions from just a small number of data points.
The Digital Efficiency Report in 2012 assessed that there are enormous cost differences between digital transactions and those involving the post or telephone calls. Now we have over 1,000 measurements, we think there is a clear trend emerging that backs up this assessment.
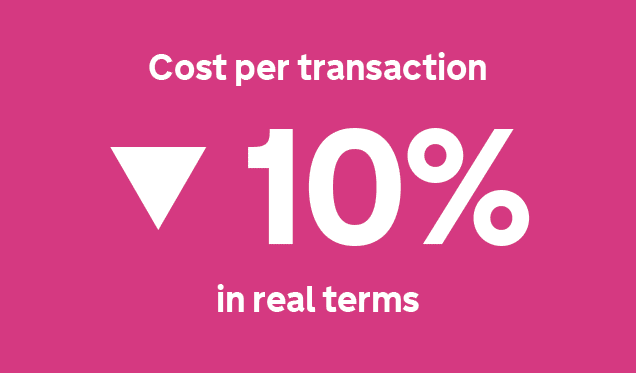
As the tables below show, over the course of a year and a half, costs have steadily fallen 7% in nominal terms, and 10% in real terms.
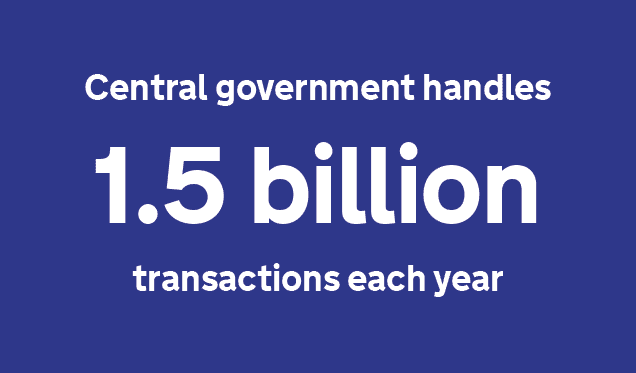
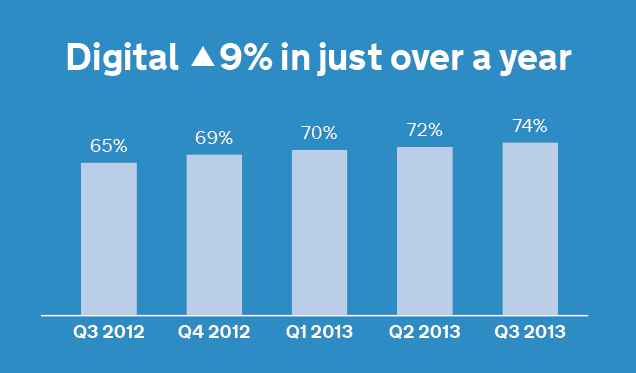
Over five quarters, digital take-up has also risen steadily by 9%. With 1.5 billion transactions between government, businesses and citizens each year, small falls in costs equate to hundreds of millions of pounds in savings for users and the taxpayer.
| Average digital take-up (%) | |
| July 2012 - Sept 2012 | 64.89% |
| Oct 2012 - Dec 2012 | 68.48% |
| Jan 2013 - Mar 2013 | 70.38% |
| Apr 2013 - Jun 2013 | 71.63% |
| Jul 2013 - Sept 2013 | 73.52% |
| Average cost per transaction | |
| Apr 11 - Mar 12 | £5.007 |
| Jan 12 - Dec 12 | £5.048 |
| Apr 12 - Mar 13 | £4.988 |
| Jul 12 - Jun 13 | £4.936 |
| Oct 12 - Sep 13 | £4.653 |
We took the figures above from a sample of the total 771 services central government provides. 138 services supplied information on their cost per transaction; 371 services supplied data on their digital take-up.
Still, we believe these numbers are robust. We prioritise collection on the largest services, and these 138 services cover 94% of the total volume of transactions between government, citizens and businesses.

The raw data is published here. We have weighted both indexes to reflect the relative size of different services, and we used linear interpolation to ensure that any gaps in the data didn’t skew the averages. The Transactions Explorer has more detail on how we calculated the numbers here.
Variation on a theme
Across the hundreds of services covered by the data, the picture is, of course, uneven. Some of the fastest risers include the DVLA’s Statutory Off Road Notification (68% to 94%); DWP’s Carers Allowance (0% to 25%); and Home Office Visa and Immigration applications (62% to 81%). Even digital applications for fishing rod licences rose from 16% to 37%.
Many services (and especially the smaller services) still have little or no digital take-up, and have not changed over this period. There are still a lot of services with a surprisingly high cost per transaction.
Here to help
GDS doesn’t just help to collect and publish these figures, but exists to work with other parts of government to improve them.
We are closely involved with 25 of the largest services through the Transformation programme, but beyond those 25 we continue to work with departments to build digital capability and support service improvement.
We continue to update the Digital Service Manual, run service assessments, and provide training for service managers. The GDS recruitment hub has helped departments to fill a number of senior digital roles. We also continue to operate Cabinet Office spending controls over digital and IT expenditure.
Service level analytics are also an important part of our ability not just to appraise service performance, but to help those responsible for those services to make improvements.
The Performance Platform has more detailed dashboards available for about a dozen services. I’ll be talking more in a future post about the way service managers will soon be able to connect their own services to the platform, to help them understand how we’re doing.
Follow Richard on Twitter, and don't forget to sign up for email alerts.


2 comments
Comment by Richard Smith posted on
I am pleased to see this published data. I certainly feel that the online offering from all government departments being improved and used. Perfect.
However Billie Johnson is right, the whole broadband issue needs to be resolved sooner rather than later.
One improvement I would like to see is more interactivity between SMS and Digital, perhaps even using Apps to communicated with government departments. Something I think is overdue. Further on the SMS front using this a confirmation method for transactions would provide proof of transaction, helpful of course when things go wrong..
Comment by Billie Johnson posted on
Members of the Institute of Agricultural Secretaries & Administrators (IAgSA) raised concerns at their recent AGM on the lack of broadband service (and mobile signal) in rural areas. If the Government expects farmers to make returns online, then action must be taken urgently to remediate the situation. Superfast? Some people can't even access superslow!