A few weeks back, we were chatting about the architecture of the Individual Electoral Registration web service. We started discussing the pros and cons of an approach that would provide a significantly different interaction for any people not running JavaScript.
"What proportion of people is that?” an inquisitive mind asked.
Silence.
We didn’t really have any idea how many people are experiencing UK government web services without the enhancement of JavaScript. That’s a bad thing for a team that is evangelical about data driven design, so I thought we should find out.
The answer is:
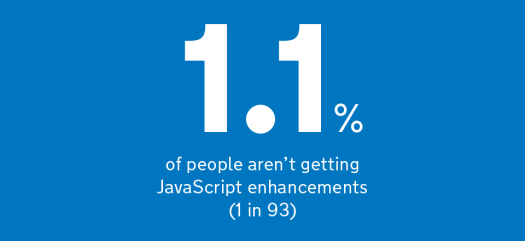
So, 1 user in every 93 has JavaScript disabled?
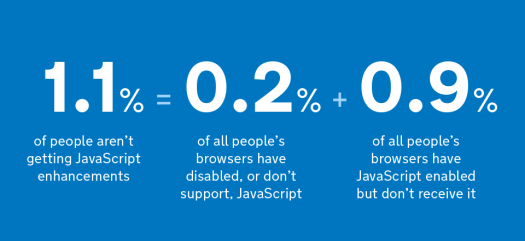
No. Surprisingly, the proportion of people that have explicitly disabled JavaScript or use a browser that doesn't support JavaScript, only makes up a small slice of people that don't run JavaScript.
So what: shouldn’t we support people without JavaScript anyway?
Yes, we do support them.
This isn’t about whether we should offer a good service to non-JavaScript people, progressive enhancement, done well, ensures we always will. But it’s interesting to know that 1 in 93 people will experience the design without JavaScript enhancement - especially when it comes to prioritising how much of our time to spend on that design.
How did we calculate these numbers?
Unlike other interesting numbers (such as IE6 or mobile device usage) it wasn’t a simple web analytics query - not least because standard analytics packages typically capture usage through the execution of JavaScript.
Web server logs tell us more, but they won’t tell us whether people are running JavaScript. Perhaps a combination of the two then?
Web server traffic - JavaScript analytics traffic = non-js traffic?
Well, we tried this, but in short, it wasn’t accurate enough. There was enough variance in the data as a result of local and corporate caching, bots, analytics blockers, timing, latency in the disparate logging etc to worry us about the accuracy of the data coming back. Particularly when we’re dealing with relatively small proportions.
What was the solution?
So @tombaromba hacked some code in the GOV.UK homepage (similar to an approach inspired by an experiment Yahoo! Conducted in 2010). We chose this page because of its high volume of traffic and low likelihood of any bias towards a particular user group or demographic.
This code included three images, of which browsers should request two.
First, an image that virtually all browsers would request (the ‘base image’).
And either
- an image that only browsers executing JavaScript would request (the ‘script image’)
- an image that only browsers not executing JavaScript would request (the ‘noscript image’)
We deployed this code and then collected the log data from over half a million visits. I expected that number of ‘base image’ requests would closely equal the combined ‘script image’ and ‘noscript image’ requests.
I was wrong.
509,314 visits requested the ‘base image’.
503,872 visits requested the ‘script image’.
1,113 visits requested the ‘noscript image’.
Which meant that 4,329 visits weren’t requesting either the ‘script image’ or ‘noscript image’. Significantly higher than the 1,113 visits requesting the ‘noscript image’.
Why is there such a big difference?
I *now* know that ‘noscript’ tags will only be followed by browsers that explicitly have JavaScript disabled or don’t support JavaScript at all. So a significant number of people had a JavaScript enabled browser but still didn’t run the scripts successfully.
It’s hard to know exactly why these browsers didn’t run the JavaScript, but a number of possible reasons are:
- corporate or local blocking or stripping of JavaScript elements
- existing JavaScript errors in the browser (ie from browser add-ons, toolbars etc)
- page being left between requesting the base image and the script/noscript image
- browsers that pre-load pages they incorrectly predict you will visit
- network errors, especially on mobile devices
- any undoubtedly many more I haven’t even thought about...
So while these are interesting reasons, ultimately the reason why someone doesn’t receive the enhancements is largely irrelevant. What's important is understanding how many people this is, and now we know.
Is there a trend?
This is the first time that we have carried out this analysis at GDS. We have earlier results from Yahoo!, which suggested that in the UK in 2010, 1.3% of people were disabling JavaScript.
Since 2010 there has been strong growth in the use of smartphones, most of which will receive and run JavaScript, so it’s not unexpected that the numbers have fallen slightly and I would expect that to continue.
We can’t be sure how comparable this data is with the Yahoo! data. The user base may be different and we can't be sure if Yahoo! was just measuring people explicitly disabling JavaScript or also including those not running it.
We will look to repeat this analysis on a more regular basis and will share anything interesting we find.
Pete Herlihy is a Product Manager, GDS
Follow Pete on Twitter: @yahoo_pete


46 comments
Comment by colin posted on
An observation:
1 in 93 is a very misleading approximation of 1.1% because
1 in 91 is the closest approximation in the "1in X" format. (X is integer). In fact X can be any number from 87 to 95 inclusive. All nine of these will round to 1.1% (1dp) but 1 in 91 is 20 times more accurate than 1 in 93.
Admittedly this error is completely trivial in the sense that it _should_ not have any direct effect on any arguments above. So you might think I am a pedant. But my point is that once you see this error, and the fact that no-one has flagged it, it inevitably does diminish ones confidence in the quality of the rest of the discussion.
Comment by robino posted on
There is also quite some visitors who have disabled image-loading in their mobile browsers. Which would explain why the images were not loaded in the first place.
Comment by Eliot Sykes posted on
I'm late to this story sadly...I wonder how these stats might differ if all requests were served over SSL/TLS. That would prevent services-in-the-middle like mobile networks, hotels, schools et al from injecting page breaking scripts that prevent latter scripts from executing.
Comment by Vincenzo posted on
Gosh, why has the URL of this post changed? It's been linked from all over the Internet and now they are all returning 404! 🙂
Comment by Carrie Barclay posted on
Sorry - we had a little glitch there! Should all be sorted now.
Comment by Me! posted on
Such good news for a lame java tweaker like me 🙂
Comment by Paying down (technical) debt in the departments and policy publishing platform | Inside GOV.UK posted on
[…] Go for a new project (GDS technology blog) Building a new router for GOV.UK (GDS technology blog) How many people are missing out on JavaScript enhancement? (GDS blog) Do we need British Sign Language on GOV.UK? (accessibility […]
Comment by Making transparency data more transparent with a CSV preview | Inside GOV.UK posted on
[…] Improving browse and navigation Government as a data model: what I learned in Estonia (GDS blog) How many people are missing out on JavaScript enhancement? (GDS blog) Do we need British Sign Language on GOV.UK? (accessibility […]
Comment by A time for sharing (government content on Facebook and Twitter) | Inside GOV.UK posted on
[…] one year on Improving browse and navigation GOV.UK goes to Estonia (GDS blog) How many people are missing out on JavaScript enhancement? (GDS blog) Do we need British Sign Language on GOV.UK? (accessibility […]
Comment by No Javascript Day ← Terence Eden's Blog posted on
[…] to this recent post by the UK Government's web team, approximately 1.1% of their visitors don't or can't use […]
Comment by RSwilson posted on
How about the most obvious answer: Stop making annoying Javacript behavior?
Comment by Sth posted on
Apart from browser related bugs and slow connection issues, there are people - as Mo mentioned too at #47404 - who prevent certain types of JS from running. Personally I disallow all 3rd party JS files by default and I whitelist them only if the page really requires them, or if they are those widely used ones like jQuery.
Comment by agtrier posted on
Let there be another series of JS-related security issues going through the media and you're going to see non-JS user numbers going up sharply (only to fall back again after a short while). Prediction.
Comment by Alf posted on
There's a bug in Chrome where if "Do not allow any site to run JavaScript" is set in the preferences, it will often display the contents of noscript tags as raw HTML rather than rendering them, until the page is reloaded. I see this quite often, and it may be contributing to the "JavaScript was disabled but the noscript image wasn't loaded" numbers.
https://code.google.com/p/chromium/issues/detail?id=232410
Comment by David Wolever posted on
Very interesting, thanks for the write up!
Out of curiosity, have you attempted to normalize that number for duplicate visits? Ex, if one person visits the page ten times, is that considered "one user" or "ten users"?
Comment by Pete Herlihy posted on
We haven't gone into that level of detail yet. These were raw requests rather than unique ones. We'd need to have a bit more data in our logging next time to allow further analysis like this. Worth looking at though, for sure.
Comment by michelle posted on
I would assume that a fair portion of your missing numbers are people running browser add-ons such as NoScript or Ghostery.
Comment by Michael (Minneapolis Designer) posted on
Very interesting! Being based on a such a large number of visitors and what I assume is a diverse demographic makes it even more useful.
Comment by Nicholas C. Zakas (@slicknet) posted on
I'm very excited that someone with a significant amount of traffic decided to duplicate the Yahoo experiment (disclaimer: I'm the one who did the Yahoo experiment and wrote it up). We also saw a lot of mysterious requests that we ultimately figured out how to deal with.
One of the issues we ran into was page abandonment, where the page would start loading but never finish. We tracked this by having a beacon at the very start of the page and one at the end. The only thing we found to be true all the time was number of requests > number of top beacons > number of bottom beacons. We surmised page abandonment occurs when there is a network drop or user navigation during page load. This is the same reason why ad impressions never line up directly with page views.
If you'd like to chat more and compare our results, please reach out to me.
Comment by Pete Herlihy posted on
Hi Nicholas, I had a feeling we might hear from you 🙂
I now think understanding the 0.9% will be useful, particular as pre-loaded pages that aren't viewed will be inflating this number - without actually affecting people. I'm guessing you didn't have to worry about pre-loading when you did your research?
Comment by Christian Longe posted on
An idea to test for pre-fetching and other potential issues:
Right now you are only testing the download of images, but to have a better idea of what is actually occurring with that 0.9%, couldn't you add the javascript to a file at the bottom of the page, then test the download rate of the script file compared to the js image and base image?
I don't know much about pre-fetching in the sense of what is pre-fetched and what isn't, but if the javascript file is something that is pre-fetched, which I would assume it is, you could compare the download rate of that file with the js image to help determine which users pre-fetched compared to those that left before finishing the download. This data, of course, would get grouped with users that have javascript fail, but at least you would have another split in your data. It may not end up helping that much, but I think it would be worth a try.
Comment by Alice Young posted on
I find this topic to be interesting because in the past six months I have heard from three distinct users about my backbone-enabled site not working at all. Their specific description of the problem tells me that the javascript is not running. However, they do not get the big orange "you must enable javascript to use this site". In all cases they were using recent browsers on Windows -the last one I heard from was using IE10. Their email addresses belonged to school systems. This leads me to believe that either 1) the school is blocking non-whitelisted javascript requests (my minimized .js file), 2) the school is injecting some other javascript (as hotels sometimes do) which causes an error and prevents my javascript from running, or 3) they are infected by something that is causing errors by choking on my javascript. It's still a drop in the bucket when I have > 120K unique users, but I would really like to get to the bottom of it, and find a workaround that recovers from their errors and lets my website run correctly.
Comment by Rick Lowes (@ricklowes) posted on
Very interesting and useful info. For those who are interested in the stats of non-JS users, these surveys may also be of interest:
Survey of screenreader users: http://webaim.org/projects/screenreadersurvey4/#javascript
Survey of low-vision users: http://webaim.org/projects/lowvisionsurvey/#javascript
Survey of users with motor disabilities: http://webaim.org/projects/motordisabilitysurvey/#javascript
Comment by Olivier posted on
I use to browse the web with a very slow connexion. Altough many website are built with progressive enhancement in mind, one thing is often unchanged : default request timeout.
Since my connexion was slow AND low bandwidth, I would never be able to get a full page at once, so I would need to reload it 4, 5 times in order to fill the cache and get every assets (often js is at the bottom of the page).
This way, I was requesting the js only at the last request.
Comment by Manuel Strehl (Boldewyn) posted on
Thank you for sharing this very interesting data and your methods for collecting it!
There is an important takeaway twinkling through the data: JS failing to load can happen to everyone. (Think of Google Analytics having a hiccup and taking the web with them, happening regularly before async tracker embedding.)
This is a key part of accessibility, that should be taught with the sledge hammer to each able-bodied developer on earth: It can happen to you, too, and you don't need to run in front of a bus for it. Develop the site, so that it's robust concerning all possible ways the receiving end may struggle.
Comment by Jake Archibald (@jaffathecake) posted on
Browsers with prescanners (all modern ones) could make up some of that 0.9%. The browser could decide to preload a page that it thinks will be loaded, so it fetches the html and downloads the assets, but doesn't execute script until the page is actually opened. If the page isn't opened, it'll fall within that 0.9%.
Comment by Ian Culshaw (@culshaw) posted on
beat me to it, I'd be curious to see if this idea matched up with your log of browsers with prescanning enabled over the period.
Comment by michaeldfallen posted on
That would be a difficult situation to test for, any idea how we might improve the test to distinguish between a browser using a prescanner and a browser failing for some other reason to download either of the with-js or without-js images?
Comment by Manuel Strehl (Boldewyn) posted on
Browsers send a HTTP header, when they pre-fetch ressources, e.g., X-moz: prefetch for Firefox. https://developer.mozilla.org/en-US/docs/Link_prefetching_FAQ That could be used to filter out prefetched sites, when they aren't visited (i.e., the second image is never requested).
Comment by Ian Culshaw (@culshaw) posted on
This might help? http://www.whatwg.org/specs/web-apps/current-work/multipage/links.html#link-type-prefetch
Also a bit more archaic, could you compare without-js requests with those who rendered the page in access logs and negate the ip/browser matches who appear in both lists?
Reading here also says browsers send a prefetch header, but further reading suggests Chrome doesn't http://stackoverflow.com/questions/9852257/http-header-to-detect-a-preload-request-by-google-chrome
Comment by Steve Souders posted on
Jake is right. I bet nearly all of this 0.9% is due to quick clicks leaving the page before the inlined SCRIPT is executed fetching with-js.gif. The fix is to put that inline SCRIPT at the top of HEAD so it's not blocked from executing.
Comment by Pete Herlihy posted on
Yeah, very good point Jake. Especially interesting because they're not JavaScript *failures* as such, so are likely to be inflating the 1.1%. I have updated the post to include this reason.
Now to figure out how to measure this....
Comment by aegisdesign posted on
Would the discrepency not be browsers that do not support images or that have them switched off?
Comment by Pete Herlihy posted on
I wouldn't think so, if a browser isn't looking for images then it wouldn't have requested the base image either - which is what we are taking as the total number of visits. So our numbers might be very slightly low overall, but of those that did request the base image, these proportions won't be affected by this.
Comment by Mo posted on
I suspect the primary cause will be local blocking: anecdotally, I know a few people who routinely browse only with JS whitelisted (and that's only for sites which require it); unfortunately, browsers tend to offer it only as a global switch, so the extensions which implement selective blocking (or selective anti-blocking) must have JS enabled globally, breaking the noscript element, in order for the whitelist to work.
Comment by Mike Davies posted on
Thanks for the awesome writeup and real-world figures.
The Yahoo test was flawed in that any user-agent that wasn't A-grade was redirected to a static html page, and thus weren't measured. Thus their numbers underrepresented the size of the non-JavaScript running audience. Really glad you didn't fall into that rabbit hole.
Now, my challenge for you, you have ideas about the reasons why JavaScript was failing to execute. Can you test your thesis and paint us a better picture as to what the main culprits that cause JavaScript not to run. You've started that path already by successfully reporting how many people chose to disable JavaScript in their browser.
Thanks again for the splendid work, and demonstrating once again why evergreen techniques like progressive enhancement work with the strengths of the web, and remain constantly a web development best practice.
Comment by samjsharpe posted on
Hi Mike,
It's really hard for us to test the thesis.
We are missing detail on the 0.9% as I explained above in my response to Adam, because it's people who request the base image, but neither of the other two.
Correlating those requests to enable us to conclusively say which unique agent asked for base-js but neither of the other beacon images would involve collecting a lot more fingerprinting information about those agents (to uniquely identify them) and unfortunately for us the practical and privacy concerns outweigh the benefit from that.
I'm sure we'd be really interested to see more research in this area, but for GOV.UK it's critical to maintain the trust of the users. It's therefore important that we don't abuse that trust by trying to identify and track them more than we absolutely need to.
Sam
Comment by Mike Brittain posted on
While it's useful for GDS to provide updates/improvements on this experiment, their results won't necessarily reflect the audience you see on your own site. The code for this experiment is on github (linked from article). Why not run this yourself and provide updates on your own analysis, and your own observations on how the results may be skewed?
What would be interesting to see with these results is a breakdown of the browsers, versions, and OSes that had "failing" JavaScript. Is there worse behavior amongst certain classes of user-agents? How about by ISP (some satellite service providers have very bad caching and prefetching behaviors)?
This is an excellent experiment! And I love seeing results like these being made available to the public. Thank you!
Comment by Nicholas C. Zakas (@slicknet) posted on
This description of the Yahoo experiment is misleading (I should know, I'm the one who ran it and wrote up the results). While it's true that the experiment counted only A-grade browsers, what Mike fails to mention is that the C-grade traffic was so small as to be statistically insignificant. At the time, A-grade included IE6 and higher; C-grade was IE 5.5 and prior as well as all versions of Netscape.
Comment by Adam Bankin posted on
Have you taken into account web spiders?
I would expect (perhaps erroneously) that they would request the noscript image.
Comment by Pete Herlihy posted on
Hi Adam,
Good question, but yes, these were considered and discarded. Bots and spiders won't usually request assets from a page they crawl - and looking at the user agent data this looks to be confirmed.
Comment by Adam Bankin posted on
Thanks for getting back to me. If the UA data in the logs confirm it that's good enough for me, but I do wonder about Google Image Search…
Comment by Sam Sharpe posted on
Hi Adam,
Our collection method was to collect our raw web logs from our CDN for only the URL and the User-Agent (It's up to 1000req/s, we don't usually log it) for a few (4) days.
I gave a report to Pete which detailed all of the user agents that asked for without-js (the beacon image in the noscript section) and we confirmed that didn't include bots.
What we didn't include was User-Agents who asked for base-js, but didn't ask for either of the other beacon images (the 0.9%) simply because it's pretty impossible to track with any degree of certainty which ones those are, as there aren't enough bits of identifiable information in the logs we were tracking to be able to say with confidence who was responsible for each log line and therefore link requests for base-js to requests for one of the other images.
It is of course possible that bots account for some of that missing 0.9%, which is why Pete's article is saying that somewhere between 1.1% and 0.2% of your page loads aren't getting a full JavaScript experience.
Whether that is because the page wasn't fully loaded (if you quit before the page has fully loaded, you won't ask for with-js because the JS is run after the page content has loaded, but you may ask for base-js) or it's because you are a search bot, or you are a real user without JavaScript, we can't say with certainty.
But the point of the article still stands - if you design a page that absolutely relies (we deliberately don't) on JavaScript, then 1.1% of your users (inc search engines) aren't getting the experience you intend them to and you should factor that into your decisions.
Sam
Comment by Pete Herlihy posted on
A quick look at log files showed no discernible bots in the traffic, so I think they won't be influencing the results in any significant way. I'd be surprised if sophisticated image bots collected beacon images (but you never know).
Comment by Simon Bostock posted on
Any chance that some of the 0.9% just failed to load the page correctly? eg they were on mobile with patchy reception and the page just didn't load properly
Anyway, this is nit-picking 🙂
Small but significant number, roger roger! Good work for making it interesting too!
Comment by Pete Herlihy posted on
Yeah, it's possible - although they would have to have requested the base image and then dropped the connection before requesting the JavaScript one. I'm including that scenario in the 'network errors' reason.