
I worked with Citizens Advice and its data for 7 months. In this post, I explain how this continued collaboration improves government services, content, policy and user experience.
Citizens Advice is the UK’s largest independent advice provider. Between 2016 and 2017, it helped 2.7 million people.
Advice is given face-to-face, over the phone, by email and web chat. The Citizens Advice website received 43 million visits last year.
As part of this project, I worked with Pete Watson, Principal Data Manager, and Sue Edwards, Partnership Intelligence Manager at Citizens Advice. We worked together to create a better way for people to visualise and interact with data, and to understand how users’ real-world issues are interconnected and often cluster.
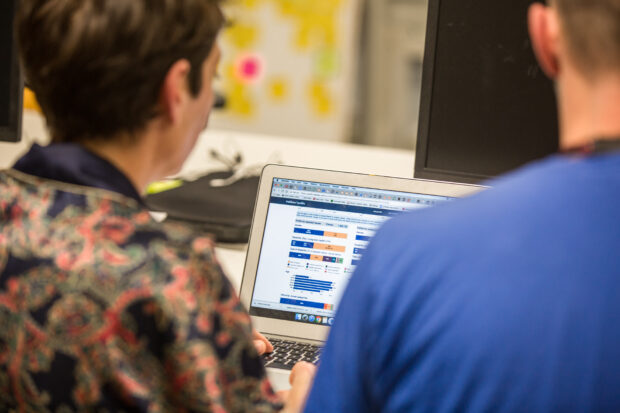
We did this through the creation of dashboards.
Dashboards are a great resource to have, especially when we’re building whole, end-to-end services.
Citizens Advice data
Citizens Advice collects some amazing data: the advice people seek and information about those people.
Three layers of data are collected at local Citizens Advice:
- the main issue type (for example: ‘Debt’)
- the subject (for example: ‘Debt Relief Order’)
- the type of advice given (for example: ‘Dealing with debt repayments’)
Sharing data uncovers the offline journey, hidden from service builders in central government and often taken by the more vulnerable service users. As my colleague Ben Carpenter says:
The cluster data available in the dashboard gives a view of how users’ issues and government’s policies and services often overlap and interconnect. This information can help us work together based on the needs of users, away from the more singular view we often have in government as service providers.
The first few months
In the first couple of months, I worked with Pete Watson. I looked at the types of data Citizens Advice collected, who used it and who could potentially use it. Armed with my findings, Pete started to mock up the first ‘Advice trends’ prototype dashboard.
Sue Edwards, Nick MacAndrews and Emily Nash from the Partnership Intelligence team and I visited several government departments to test the dashboard.
Sue and I visited HMRC in Newcastle first. Stephen Proctor, a content designer based there, helped us to identify three areas for improvement:
- navigation: it was hard to find the data and move between sheets. It was also difficult to sort and filter the data. There is now a search page that makes it easier
- language: the use of internal jargon caused problems
- labelling: there was a need for clearer instructions and descriptions of data
We tested the dashboard with data scientists, analysts, and service design and content teams. We also worked with Home Office Digital, Scottish Government and other policy professionals during a knowledge series event.
We asked 2 questions during testing:
- What are you trying to find out about the people using your service?
- What improvements can we make to the dashboard?
We received 271 pieces of feedback about which data should be included on the dashboard. There were 300 suggestions to improve the design and interaction. This feedback translated into 150 improvements to the dashboard!
Some of the most prevalent themes were:
- access to anonymised case studies to help understand the content of users’ issues and build empathy
- cluster data – it’s rare that people have one issue. This data helps to identify relating issues to identify crossover between services
- user demographics
The dashboards
Here are the three dashboards we worked on:
1. ‘Advice trends’ dashboard
This is interactive, open to everyone and updated monthly. It reports the non-consumer service issues (immigration, benefits and tax, debt, housing) that people ask Citizens Advice about, and their demographics.
2. Case studies dashboard
This dashboard is open to government staff only. It includes powerful, anonymised case studies that bring to life the breadth and intensity of users’ full journeys, beyond government websites and call centres, into the third-party face-to-face channels.
3. ‘Consumer advice trends’ dashboard
This dashboard, open to everyone, shows data from Citizens Advice’s specialist consumer and energy advice services.
Building lasting relationships
To support the use of the dashboards, we created an online community. This enables Citizens Advice to share new data releases, emerging data trends and research reports, and for people in government to discuss and share ideas. We already have 110 members!
People working in government can request access to the case study dashboard and the community by emailing the Partnership Intelligence team at Citizens Advice.
I loved working with Citizens Advice and I’m proud of what we achieved in such a short time.
Pete Watson said it was a very rewarding collaboration that allowed them to try out new ways of visualising and presenting data.
The work is still ongoing. In the next few weeks, Sue and I will review the feedback from the email group and survey users of the dashboard.
If you would like to know more about this project or how you could use Citizens Advice data, please leave a comment below or email the Partnership Intelligence team.

6 comments
Comment by Andy Jones posted on
Great collaboration, well done to everyone. We can't evolve digital and build better services that really reflect customer need without insight. This will enhance our understanding of how people are really impacted. Bring on better services. Congrats.
Comment by Nikaesh Rattan posted on
The Dashboard is a much welcomed tool to possess with the great work already done by Citizens Advice (who help tirelessly). I was amazed to read Citizens Advice received over 40 million hits in 12 months. This a great step in sharing real life and true challenges which are being faced by citizens all over the UK and I believe this a milestone allowing stories, examples and real life to come in to play whilst the partnership intelligence go from strength to strength.
Comment by Alan Rider DfT Digital Capability Lead posted on
An amazing project that really shows the power of data to help vulnerable users - which is brilliant. I know how hard and how long you have worked on this Lorna so well done.
Comment by Jenny Mulholland posted on
Sounds like a great project. I will share it with my friend who is a Citizens Advice volunteer 🙂
Comment by Carol Butterfield posted on
Wow this is an amazing piece of collaboration. I can see it benefitting so many people and teams. Congratulations everyone.
Can you please add me to your mailing list? Thanks
Comment by Lorna Tang posted on
Hi Carol,
Thank you, it was a really rewarding project to be involved in .
I've just sent you an email.