This is part of our blog series intended for a technical audience. While we try our best to explain things clearly, we will use technical terms in common use in the industry. As part of our practice of working in the open, GDS likes to write about our technical work, so that we can share and connect with technical specialists around the world.
On GOV.UK Pay, we're evaluating options to improve our monitoring and observability capabilities which help us ensure GOV.UK Pay is efficient and reliable.
In this post we show how to set up a new AWS feature called CloudWatch cross-account observability using Terraform.
GOV.UK Pay runs on AWS and like many organisations, it has multiple AWS accounts to separate our test, staging and live environments, as well as separating our deployment and testing infrastructure. We use a combination of Cloudwatch for our AWS generated Infrastructure metrics and a SaaS product to aggregate our application metrics. One of the downsides with this setup is that engineers need to log into multiple AWS accounts and the SaaS UI to view metrics, making it difficult to correlate behaviour across environments. We're considering ways to improve our monitoring systems and a recently launched AWS feature called "cross-account observability" looked like it could help fix this problem. It allows a single AWS account to access instrumentation data from multiple AWS accounts. The potential benefits of this are:
- it gives all technical staff on the team access to CloudWatch monitoring in one place, removing the need to have production access in order to view production metrics
- it avoids the need to log in and out of different accounts to view metrics
- we can potentially codify all CloudWatch alarms and dashboards in one place which could make for simpler code organisation
- we could make correlation and contextualisation of data easier
- there's no extra cost for logs and metrics — traces can be shared with one monitoring account at no cost, but will incur costs if shared with additional monitoring accounts — this will provide cost savings for us as our monitoring SaaS product pulls data from the CloudWatch API which comes at a cost
When exploring CloudWatch cross-account observability, we wanted to configure everything using Infrastructure as Code using Terraform and avoid having to manually configure ("click ops") anything at all. Unfortunately, all the examples found on the internet used the click ops method, and there is sparse documentation on how to configure it in Terraform. Thankfully, we were able to configure everything in Terraform and thought it would be good to share our solution with the world!
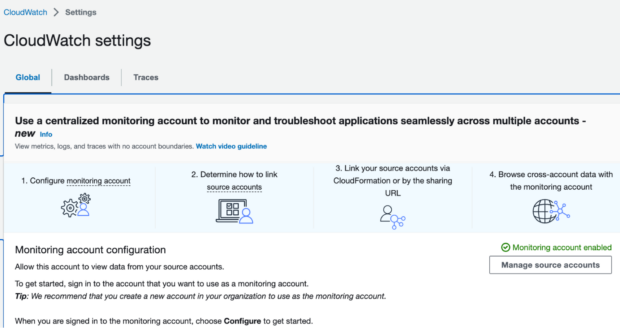
Configure a monitoring account
A source account is an individual AWS account that generates observability data for the resources in it. A monitoring account is the account that can view and interact with observability data generated from source accounts. Configuring the monitoring account requires us to configure a Sink and a Sink policy.
This is quite simple (note you’ll need to supply the source account IDs):
variable "source_account_ids" {
 type = list(string)
}


resource "aws_oam_sink" "monitoring_account_oam_sink" {
 name = "ExampleSink"
}


resource "aws_oam_sink_policy" "monitoring_account_oam_sink_policy" {
 sink_identifier = aws_oam_sink.monitoring_account_oam_sink.id


 // See https://docs.aws.amazon.com/OAM/latest/APIReference/API_PutSinkPolicy.html for examples
 policy = jsonencode({
   Version = "2012-10-17"
   Statement = [
     {
       Action   = ["oam:CreateLink", "oam:UpdateLink"]
       Effect   = "Allow"
       Resource = "*"
       Principal = {
         "AWS" = var.source_account_ids
       }
       Condition = {
         "ForAllValues:StringEquals" = {
           "oam:ResourceTypes" = ["AWS::CloudWatch::Metric"]
         }
       }
     }
   ]
 })
}
Once applied, you should be able to verify in the AWS console that the monitoring account has been enabled:
Configure source account(s)
For each source account you’ll need to:
- create a link to the monitoring account
- enable the AWSServiceRoleForCloudWatchCrossAccount role — which is created by CloudWatch when the monitoring account is enabled — in the monitoring account to assume the CloudWatch-CrossAccountSharingRole role in the source account.
The terraform configuration for this:
variable "monitoring_account_sink_identifier" {
 type = string
}


resource "aws_oam_link" "source_account_oam_link" {
 label_template  = "$AccountName"
 resource_types  = ["AWS::CloudWatch::Metric"]
 sink_identifier = var.monitoring_account_sink_identifier
 tags = {
   Env = "test"
 }
}


locals {
 names = [
   "CloudWatchReadOnlyAccess",
   "CloudWatchAutomaticDashboardsAccess",
   "AWSXrayReadOnlyAccess"
 ]
}


data "aws_iam_policy" "policy" {
 for_each = toset(local.names)
 name     = each.value
}


variable "monitoring_account_id" {
 type = string
}


locals {
 policy = {
   "Version" : "2012-10-17",
   "Statement" : [
     {
       "Effect" : "Allow",
       "Principal" : {
         "AWS" : var.monitoring_account_id
       },
       "Action" : "sts:AssumeRole"
     }
   ]
 }
}


resource "aws_iam_role" "aws-cloudwatch-metrics-role" {
 name = "CloudWatch-CrossAccountSharingRole"


 assume_role_policy = jsonencode(local.policy)
}


resource "aws_iam_role_policy_attachment" "policy" {
 for_each = toset(local.names)


 policy_arn = data.aws_iam_policy.policy[each.key].arn
 role       = aws_iam_role.aws-cloudwatch-metrics-role.name
}
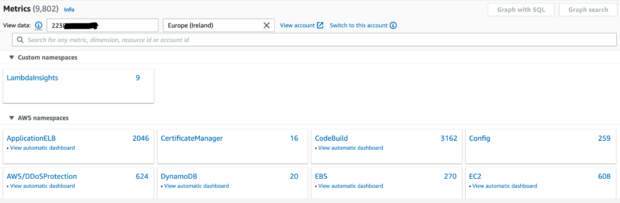
Once the above has been applied we can now go into our monitoring account and enter a source account number to see metrics from the source account:
Viewing a cross account metric
With the above set up, we were able to view cross account metrics on our self-hosted grafana dashboard on our monitoring account:
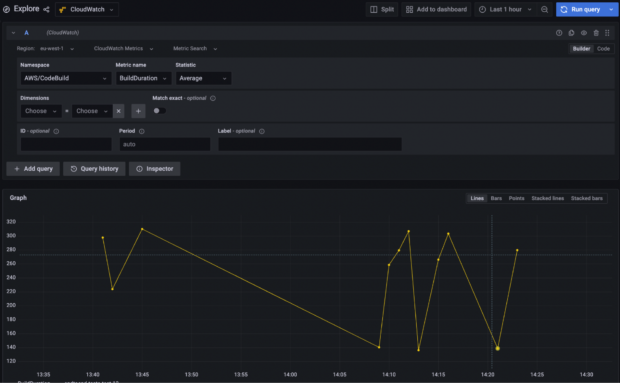
Here we are viewing a CodeBuild metric from the “test-12” environment (which is in the “test” account) from our monitoring account.
Conclusion
We were able to collate metrics from AWS resources from multiple accounts (in the same region) into one designated monitoring account. We were able to configure this completely using our infrastructure-as-code tool, Terraform. Although we focused specifically on metrics here, this should work for logs and traces too. Although we have yet to make a decision on the solution, the benefits to be had from this AWS feature seem to be compelling at the moment.
It is worth mentioning the following caveats:
- terraform version 1.x is required at minimum
- terraform AWS Provider 4.62.0 is required at minimum
- propagating metrics across different regions and accounts is not possible at the moment — for example, we couldn’t link metrics in eu-west-2 for one of our source accounts to our monitoring account in eu-west-1.


1 comment
Comment by Victor Dorneanu posted on
Thanks for sharing! This was indeed very helpful. Maybe you can reformat the source code blocks. Currently they look kind of ..nasty.