This is part of our blog series intended for a technical audience. While we try our best to explain things clearly, we will use technical terms in common use in the industry. As part of our practice of working in the open, GDS likes to write about our technical work, so that we can share and connect with technical specialists around the world.
This blog post is an experience report of conducting performance tests, highlighting the value and importance of conducting this kind of test.
Performance testing has given us confidence that our webhooks mechanism can deal with large transaction volumes. Along the way, it helped us identify problems that had not shown up in other tests. As a result, what we deliver will be more efficient and robust.
GOV.UK Pay is used by hundreds of services across the public sector to take payments. The GOV.UK Pay team recently released our Recurring Card Payments feature into production. An important part of this feature is the webhooks mechanism. Webhooks allow services that use Pay to receive messages about payment events, for example when a payment succeeds or fails. They can be used in a variety of ways, for example to trigger messages to a service's paying users or connect with enterprise resource planning (ERP) software to help automate accounting.
Preparing for the release, we were confident that the mechanism worked from a functional point of view, as we’ve had webhooks running in our sandbox environment for several months. However, we had never tested them under any load, and we wanted to be sure that the mechanism would cope when partner services start subscribing to webhooks.
How webhooks work
There are several stages in the payment lifecycle, from the point when a payment is created through to authorisation and capture. As a payment progresses through this journey, these events are published to an SQS queue.
The webhooks mechanism has 2 main responsibilities:
Subscription to the event stream
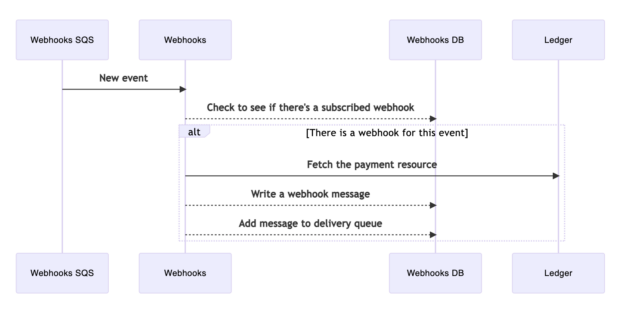
There are several stages in the payment lifecycle, from the point when a payment is created through authorisation or rejection - and authorised payments proceed to capture. As a payment progresses through this journey, these payment events are published to an SQS queue. The Webhooks app polls the SQS queue for new events, as illustrated in Diagram 1 below.
The payment events are checked against the Webhooks database for a match against existing webhook subscriptions. Services that use Pay can subscribe to receive updates on particular payment events (e.g. authorised, rejected) relating to their transactions with customers. If the new payment event matches an existing webhook subscription, the relevant payment details are retrieved from Pay’s Ledger database, and then the webhook message containing a summary of that event is then written to a delivery queue (a table in the Webhooks database).
Diagram 1 - Subscription to the event stream
Message sending process
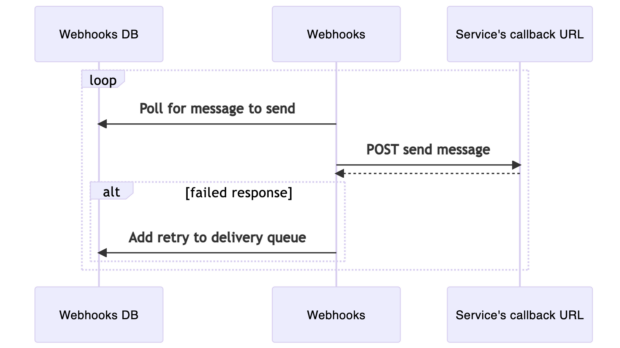
The Webhooks app also polls the delivery queue table in the Webhooks database and sends the corresponding webhook message to the relevant service (by sending a POST request to the callback URL specified by the service in the webhooks subscription). If delivery fails, a retry is scheduled.
Diagram 2 - Message sending process
If you're interested to find out more about how webhooks work, you can take a look at our source code which is coded in the open.
Our way of working
We organised ourselves into sub-teams to complete the Recurring Card Payments implementation. The Webhooks sub-team that carried out the performance testing included engineers with varying degrees of experience. We decided to employ a ‘mobbing’ or ‘ensemble programming’ approach to the work. This approach is particularly well suited to work where the team needs to quickly learn and explore new technologies, techniques or problem areas together. This would allow us to benefit from a range of perspectives when planning the tests and responding to any problems, and to introduce less experienced team members to performance testing techniques.
We carried out these tests over a couple of days. We were working remotely, so we collaborated by screen-sharing over a number of calls, with breaks as needed to clear heads and catch up with other tasks. We rotated responsibilities, with one person running the tests, another monitoring the logs, others observing. We used a Slack channel to keep in touch outside of the calls.
Our test setup
We used our performance testing environment, which is a replica of our production environment where we can safely test high levels of traffic. We used an AWS lambda to simulate the service’s URL that the webhook messages could be posted to.
The performance tests are controlled by the following parameters:
- the rate of payment transactions
- how long the test runs for
- the number of test accounts used in parallel in the simulation
- the number of webhooks subscribed to our simulated payment events
- the response delay of the simulated service URL
We monitored the system under test by collecting logs and metrics in our log aggregation tool, Splunk. The Splunk dashboard showed us various performance measures but the one we were most interested in was the "time to send". “Time to send" is the time between the creation of a webhooks message ("Add message to delivery queue" in diagram 1) and the message sending process picking it up to send ("POST send message" in diagram 2).
We examined this metric because it could be calculated from existing logs, would be heavily influenced by our application’s performance, and examining how this metric was affected in different scenarios could reveal any existing limitations of our design and provide opportunities for optimisation. The time that elapsed subsequently between sending the webhook message and receiving a response was something we could configure by modifying the AWS lambda function that controlled our simulated service URL.
A simple first test
For our first test, we sent 10 payments per second, for a single test account with one webhook. This meant that for each payment, there should be one webhook message sent. We also configured the simulated service URL to take 100ms to respond.
Chart 1 - Time to send webhook messages throughout the first test
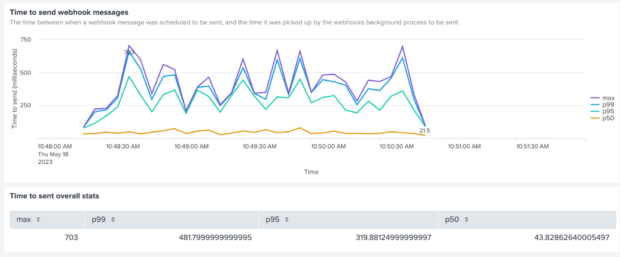
All the webhook messages were sent successfully, and in good time. So far so good!
We then started to apply a bit more pressure, increasing the transaction frequency, having multiple accounts with different webhook subscriptions. We saw the time-to-send increasing, but no alarm bells were ringing yet.
Problem 1 - Database lock
One big unknown in all of this is the speed of response from the service confirming that the webhook message had been received. We can give some guidance to services about how quickly we would like them to respond, but it is largely outside of our control, so we had been wondering what would happen if there was a significant delay in the response.
We increased response time from 100ms to 2 seconds and reran the test.
Straight away our dashboard showed us that there was a problem.
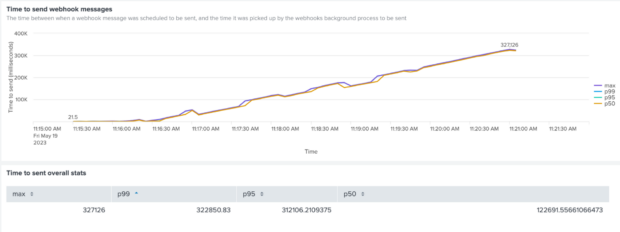
Chart 2 - Time to send webhook messages when there is a 2-second response delay
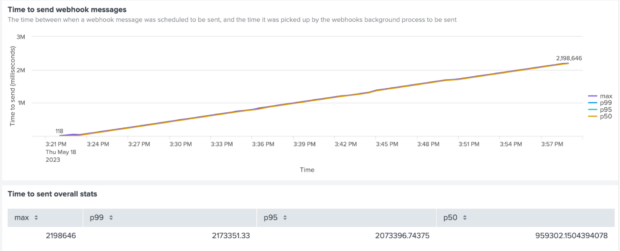
The chart illustrates that webhook messages were still being sent for more than 30 minutes after the payment events. Clearly our system was not sending out webhook messages fast enough to keep up with new payment events.
At this point we really benefited from the ‘mobbing’ approach to this task. With 4 engineers looking at the same data, we discussed possible causes for this behaviour. We then took a break from the call, following up some different avenues individually, keeping in touch via Slack.
One of the team looked at the logs to investigate concurrency in the sending of messages. They found that messages were only being retrieved from the database at a rate of one every 2 seconds, with threads operating sequentially rather than concurrently, as if the threads were in a queue to send messages and only one could get out at a time. Were threads being blocked from querying the database? This led us to look at how each thread retrieved the webhook messages from the database.
Our database queries use the Hibernate framework (behind the scenes, Hibernate turns our commands into SQL queries to interrogate the database). The query to get the next webhook message included the following statement:
.setLockMode(LockModeType.PESSIMISTIC_WRITE)
Applying a PESSIMISTIC_WRITE lock means that while the lock is in place other transactions cannot modify that row of data. This was employed here to allow the thread carrying out the transaction to read the data, send the webhook message, and on receiving the response from the subscribing service, to update the delivery_status field to confirm that it has been dealt with, without the possibility of other threads attempting to act on the same row of data. The code further specified:
<span style="font-weight: 400">LockOptions.SKIP_LOCKED</span>
This ensures that when a row is locked, the thread trying to read it will skip to the next row, rather than to wait for the lock to be released. Again, this was appropriate, and necessary for concurrency.
So what was going wrong?
We were telling Hibernate the right thing to do, but the next step was to make sure that Hibernate was actually doing it.
We debugged the procedure, logging the raw SQL query generated by Hibernate. It turned out that Hibernate was not including the ‘SKIP_LOCKED’ command in the SQL query that it generated. If a thread trying to access a locked row was not being instructed to skip past it, it would have to wait until the row was unlocked before it could continue - which would explain what we’d observed.
But why was Hibernate ignoring the SKIP_LOCKED command? With a bit of research we found out that the default dialect of PostgreSQL that Hibernate was configured to use did not include SKIP_LOCKED, and so it just ignored the command. We specified a compatible dialect (version 10), and verified that the resulting SQL query did now include SKIP_LOCKED. Now multiple threads could pick up webhook messages concurrently.
Problem 2 - http request bottleneck
With the first problem apparently diagnosed and fixed, we reran the tests, hoping to see our system sending webhook messages in step with the flow of events. This would be demonstrated by a nice flat line on our chart.
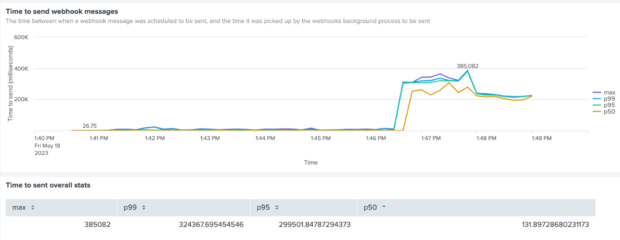
Chart 3 - Time to send webhook messages when there is a 2-second response delay (after fixing the SKIP_LOCKED issue)
This shows an improvement, but the backlog is still building up, so something still was not right.
Digging deeper, we found that the number of webhook messages sent per minute had dramatically increased from 30/min to ~445 per minute, but there was a bottleneck in the process that was sending the messages as HTTP requests to our lambda endpoint.
With a bit of arithmetic, we worked out that of the ten threads running, half were always waiting for 2 seconds after picking up a message before they could make the http request to send it.
To remedy this, we introduced a connection pool manager to our webhook message sending service, configuring it to allow sufficient available connections to support the number of threads.
Problem 3 - Queue ordering
Chart 4 - Time to send webhook messages when there is a varying response delay (after fixing the available connections issue)
Now the rate of sending webhook messages had increased to ~1670 per minute, and everything is going well until towards the end of the test, when we see the final webhook messages taking much longer to send.
We puzzled over this for a while. When looking at the time to send (peaking at over 5 minutes), we realised that this must mean that there were webhook messages that had been created at the beginning of the test run that were not actually sent for several minutes. Why would the messages that had been created first not be retrieved from the database for sending until much later? Logically this meant that the query was not picking the oldest messages first….and then the penny dropped. Our query was just picking the first webhook message that it found, but without any ordering. So with a heavy load of webhook messages, it was quite feasible that a webhook message could be left unattended for a long time.
We introduced an ORDER BY statement to the query to ensure that messages were selected for sending in ascending order of creation date/time.
A finely-tuned machine
Subsequent testing showed that the factor now limiting the rate of sending messages was the maximum number of threads available to process send attempts on.
We increased the number of threads to 20, kept our response time varying between 100ms and 2000ms, and simulated 20 payments per second, which is considerably higher than anything we’ve ever experienced before, or that we would anticipate any time soon.
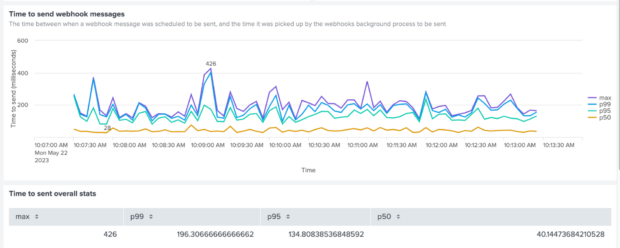
The final tests confirmed that our webhooks mechanism was able to cope with this load, with a time-to-send generally under 100ms and not exceeding 450ms.
Chart 5 - Time to send webhook messages after all fixes in place, under significant load
What we will be looking out for
We also discussed what monitoring we should put in place. The results of the early tests had shown us that in certain scenarios, a backlog of webhook messages can develop which means that the overall time-to-send will increase until the backlog is resolved. It’s hard to foresee the circumstances in which this might happen, but we need to be on the lookout for it.
We were already logging the ‘time to send’ for each webhook message, so we decided to build some alerts based on saved searches in Splunk which run at regular intervals. When the ‘time to send’ for an individual webhook message, or the average time-to-send over a period of time, exceeds a certain threshold, an alert will be triggered. We’re adding some guidance to our team manual so that everyone on the team knows what to do if the alert fires.
What we learned
Performance testing brought several problems to the surface that had not been revealed by unit tests, integration tests or the exposure of the mechanism to services using our sandbox environment.
Once each problem had been identified, the fixes were relatively straightforward. Without these fixes, the webhooks mechanism might have struggled with increasing demand, potentially causing knock-on problems for services and damaging confidence in our product. Diagnosing the problems and implementing the fixes would be much harder when dealing with live data, under time pressure, than in the performance test environment where we have more freedom to experiment.
We can never be 100% certain that a solution is able to handle every possible scenario that might occur in the live environment, but by repeating the same tests with increasing load and simulating a range of response times from services, we’re confident that the webhooks mechanism is robust and copes effectively with a high volume of transactions.


4 comments
Comment by Chris B posted on
Great article and such an important (and often overlooked...) part of the testing process!
Were there any particular tools you were using to help generate that amount of load as it seems like you could easily fine tune the variables and ramp up and down the simulated users?
Comment by James Peacock posted on
Hi Chris, thanks very much for your feedback and question.
We've invested in building infrastructure to support performance testing, and we were fortunate in that we didn’t have to design any new performance tests specifically for webhooks as we were able to use existing performance/load test scripts to simulate payments. These are based on Gatling (https://gatling.io/). We designed the scripts to be controllable by environment variables, so it was straightforward to tweak the settings, for example:
export RAMPUP_USERS_FROM=1
export RAMPUP_USERS_TO=30
export RAMPUP_DURATION_IN_SECONDS=60
export CONSTANT_USERS_AFTER_RAMPUP=30
export CONSTANT_DURATION_AFTER_RAMPUP=300
As well as altering these settings, we were also able to make changes to the AWS lambda function to simulate delayed response time, and adjust the connection pool size via the connection pool manager. This allowed us flexibility to experiment, giving us a good picture of how the webhooks mechanism would cope under load.
Thanks,
James
Comment by Boba Fett posted on
An architectural/technology choice question. Curious as to why you utilised a database table instead of a queue to pick up webhook messages. It would've avoided the SKIP_LOCKED and ORDER BY problems. Messaging systems these days should be clever enough to not offer the same message again to another thread from webhooks requesting the next message and they implement ordering too.
Comment by James Peacock - Developer, GOV.UK Pay posted on
That's a great question.
Our team has a lot of experience building and, most importantly, maintaining Java apps backed by RDS. While there was a tradeoff in getting the mechanism right in the first place it should then be straightforward for any member of the team to pick up the code and for it to work with existing monitoring/ alerting/ pipeline/ developer tooling. There was a requirement for users of the platform to be able to debug the health of their webhook integrations and to see a history of successful/ failed delivery attempts. As Postgres is our default tool for persisting information like that, and considering the Postgres SKIP_LOCKED mechanism required no additional tech on top of what we were already using, we decided to stick with this.
A strictly-ordered, guaranteed-only-once messaging system would be a great way to design a similar system, especially in a serverless/ lambda architecture.
Thanks,
James Peacock