The Government Digital Service exists to make digital government simpler, clearer and faster for everyone. To do this, we need strong data foundations to help us make better evidence-based decisions about our digital services.
One key tool we use to understand the users of GOV.UK and other government digital products is Google Analytics (GA). Google is replacing the current version of GA, Universal Analytics or UA, with a new version, GA4. We’ve already talked about our preparations for upgrading to GA4, and the technical side of our implementation. Now, we want to open up access to our data to others across government and to share more information on the specifics of our approach.
Here we’ll explain:
- what we’ve done already
- what we’ve learned so far
- how to sign up for early access to the GOV.UK GA4 data and tracking schema
What we’ve done already
In September 2022, we began tracking a small number of high priority events (a data point that is collected to track user behaviour on our website e.g. a button click) in GA4, alongside UA.
Since then, we have continued to develop our GA4 tracking schema (a framework detailing what data we will collect and how it will be structured) and have now defined, built and deployed a large number of our medium priority events. These cover user interactions with elements of GOV.UK such as tabs within pages and accordion components.
We’ve also been comparing our UA and GA4 data sources and using GA4 data in reports and dashboards. This has helped us:
- understand how the two data sources are different
- discover issues with the GA4 data
- explore the feature differences
We’ve audited our current GA accounts, properties, and views, and have started thinking about how to rebuild these to best meet our users’ needs given the constraints of the new tool.
Recently, we’ve also been looking into how we would use GA4 for the Single Data Environment. More on this to follow!
What we’ve learned so far
How we deploy tracking updates
We have developed an agreed process involving both developers and performance analysts. Using Google Tag Manager’s versioning and environments capabilities has enabled us to control which events are available in which environment (for example, testing, production). This has meant we can test the function and usability of each individual piece of tracking before it goes live.
How we can work with GA4 data
The numbers of events we are recording in GA4 approximately match those in UA (within a few percent). However, definitions of key concepts such as sessions have changed, making comparison between the two data sets difficult.
Limitations of the GA4 data collection
Character limits on the data that we send to GA4 affect our ability to collect data. GA4 also groups events in batches when sending them, which causes issues plotting user journeys and comparing UA and GA4 data.
Limitations of the GA4 interface
Unlike in UA, you can’t have multiple reporting views in GA4 — sub-properties, the most comparable feature, cost more and do not have the same functionality.
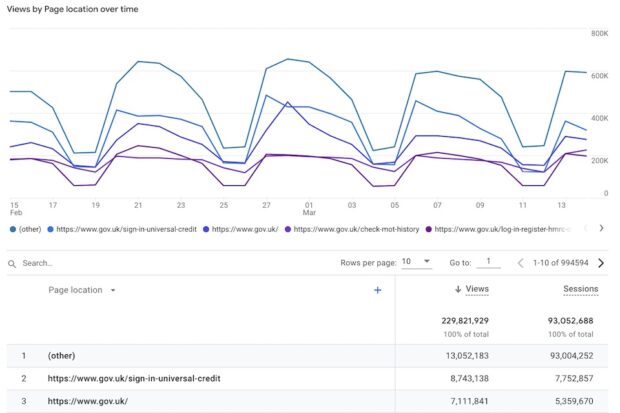
Also, issues with the reports and explorations — for example, limited column widths, date ranges not updating — mean that the interface currently does not meet our needs. In particular, the number of unique values we are collecting means large amounts of our data is currently grouped into one line and labelled (other) in the GA4 interface and in Looker Studio.
Limits on API usage
Some tools, such as Looker Studio, rely on the GA4 API to retrieve data. Strict API quota limits hamper our ability to use additional tools for reporting and analysis.
We’re still learning
Due to the limitations of GA4, we’ve often had to rely on querying the raw GA4 data in BigQuery (Google’s data warehouse where they send raw GA data) to get the information we want. This comes with its own potential problems. Changes to the data structure mean that our daily data tables are almost 20% larger in GA4, so we expect storage costs to increase. We hope that query costs may decrease if we take advantage of the more granular row level data to be more specific with our queries.
GA4 is still under development, so we are having to constantly relearn and reevaluate how we can best use GA4 and our GA4 data. New features, such as the recently released expanded datasets, may alleviate some of the issues mentioned above.
Opening up access
We’re keen to open up access to our GA4 data and to share our schema and Data Protection Impact Assessment (DPIA) with other government departments.
We’d like you to test and feedback on the data we’re collecting, so that we can check our implementation meets our users’ needs. Providing visibility of what the new data will look like will also help the migration of any reports and tools departments have which rely on GOV.UK GA data. We’d love to learn from other departments’ experiences, and hear how others are managing the issues we’re facing with GA4.
We also hope departments may be able to learn from our approach and use our schema or our DPIA to support their own GA4 implementations. Increasing standardisation would create efficiencies across government, and hopefully save departments a lot of time and resource.
If you’re a public servant who uses analytics data and are interested in early access to GOV.UK GA4 data then please sign up here. You will need a government email address to sign up. Please note that this data is still a work in progress, and the way we share access may change in future.

2 comments
Comment by Rajitha R posted on
What is Looker Studio and what do you use it for?
Comment by The GDS Team posted on
Hi Rajitha,
Thank you for your question! Looker Studio (formerly known as Data Studio) is Google’s online tool for creating dashboards and visualisations. We use it to build reports using our Google Analytics data.
Thanks
The GDS Team